| StockFetcher Forums · General Discussion · XIV | << 1 ... 5 6 7 8 9 ... 22 >>Post Follow-up |
| novacane32000 331 posts msg #141107 - Ignore novacane32000 |
1/17/2018 10:01:58 PM Yes, I noticed the signals changing also. Dust signal had changed from shortposition to longposition when I ran it Sunday night . Ran it again during the day Tuesday and the signal had changed to short and continues short today. |
| davesaint86 726 posts msg #141108 - Ignore davesaint86 |
1/17/2018 10:13:51 PM I do not know if it is the Count function that is screwing the vertical bars up. |
| Mactheriverrat 3,172 posts msg #141109 - Ignore Mactheriverrat modified |
1/17/2018 11:05:55 PM XIV -Not sure why the column on 1-12-18 is acting up. Column says long and long position / short position say sell. 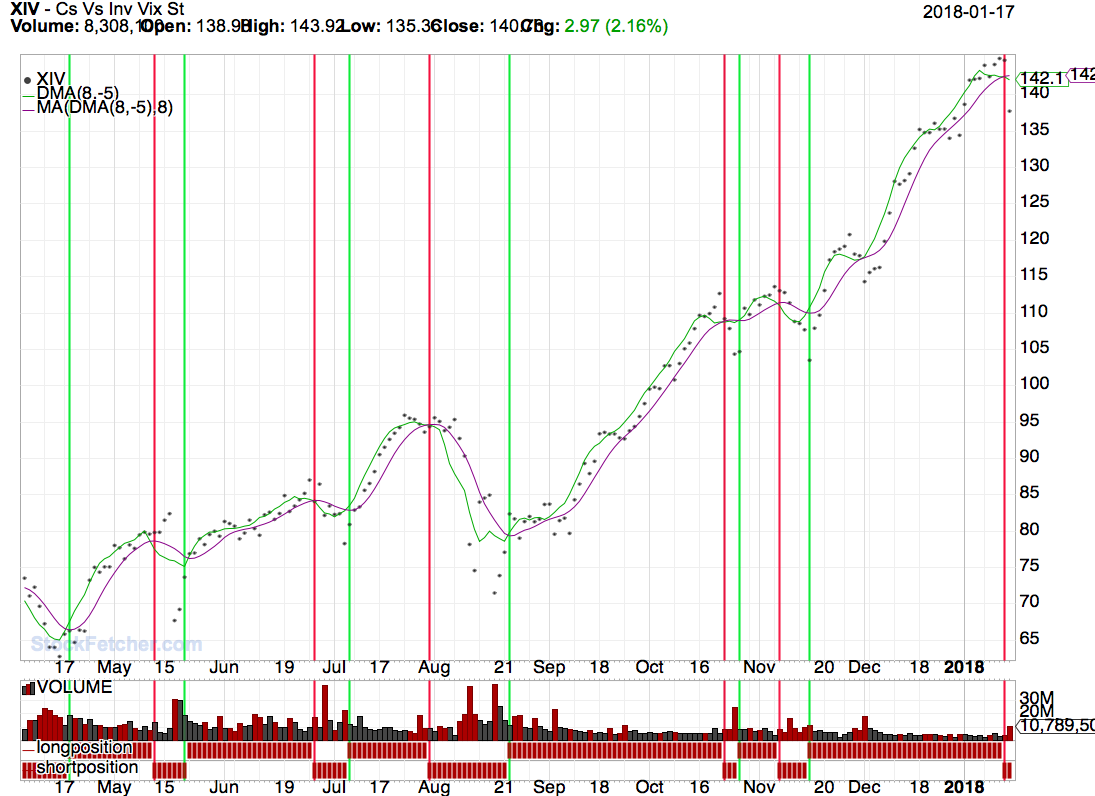 Might even be a SF data bug. |
| Mactheriverrat 3,172 posts msg #141113 - Ignore Mactheriverrat modified |
1/18/2018 12:58:37 AM Let me throw some code out here using Dave's code and some counting code from FOUR on XIV. Submit Submit Using the count code . Just how many times could one have got in and out of XIV. |
| Cheese 1,374 posts msg #141114 - Ignore Cheese modified |
1/18/2018 1:07:51 AM For an explanation of DMA & its corresponding MA, as well as a caution about why DMA should not be backtested please refer to the 2006 posts by BFreshour and maxreturn at the following link: https://www.stockfetcher.com/sfforums/?mid=39945 |
| shillllihs 6,090 posts msg #141115 - Ignore shillllihs modified |
1/18/2018 2:10:38 AM Aww that was a good read. Their feuds makes ours look tame. Looks like they didn't have spell check then either. Just kidding, my spelling is terrible. When they were kings. So did Riggs buy an island making 7k a day or what? Bottom line is, I guess DMA is not magic but maybe gets you close to something potentially magical. |
| davesaint86 726 posts msg #141117 - Ignore davesaint86 modified |
1/18/2018 7:10:48 AM I'm updating this post. Just saw your response on the previous thread where you say you do not know what 1/12 is not showing being long. Thanks Mach - In the your filter you just post can you go to the backtest feature entere 2 days and go back to 1/12, It is showing a positive number of 40 under longx-short. If this is case, shouldn't the vertical bar for 1/12 be long and not short? Thanks, Dave |
| davesaint86 726 posts msg #141118 - Ignore davesaint86 |
1/18/2018 7:14:02 AM What is funny whether the filter is screwed up or not, the prices on numerous charts that I have viewed are accurate This screwed up filter looks like it gets you in a little early and out a little early. |
| davesaint86 726 posts msg #141119 - Ignore davesaint86 |
1/18/2018 7:25:25 AM The word of the day is "unisance" , lol. |
| davesaint86 726 posts msg #141124 - Ignore davesaint86 modified |
1/18/2018 9:32:38 AM Sandjco - I do not think this is exactly what you were looking for. You can add e3 crossed above 0 for buys and e3 crossed below 0 for sells. You can always use the bactest function (date offset) to look at the previous day buy or sells and keep a record that way. |
| StockFetcher Forums · General Discussion · XIV | << 1 ... 5 6 7 8 9 ... 22 >>Post Follow-up |