| StockFetcher Forums · General Discussion · XIV | << 1 ... 13 14 15 16 17 ... 22 >>Post Follow-up |
| davesaint86 726 posts msg #141779 - Ignore davesaint86 |
2/2/2018 3:43:50 PM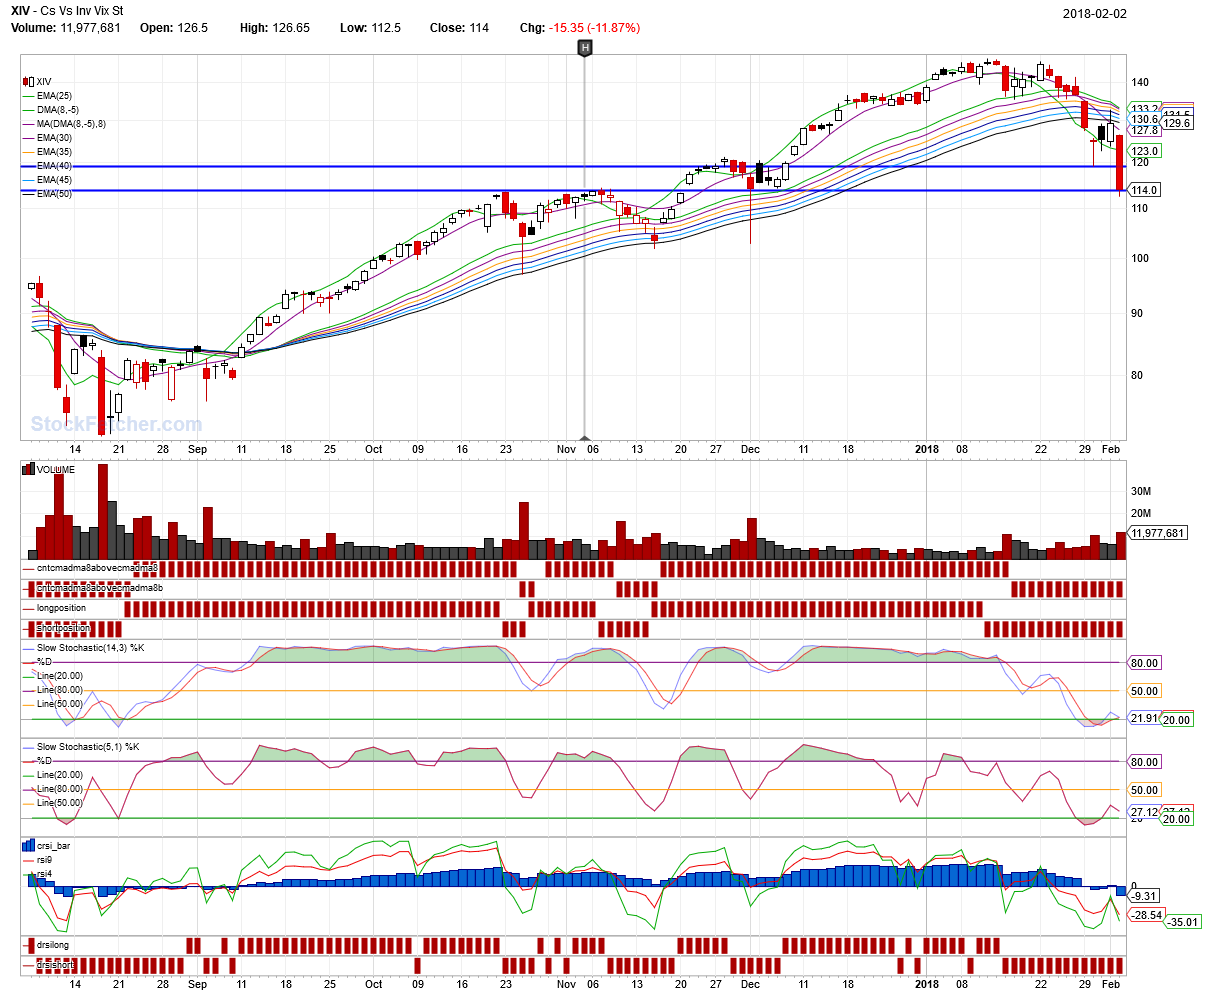 |
| Cheese 1,374 posts msg #141787 - Ignore Cheese |
2/2/2018 5:16:33 PM per Eli Mintz, $VIX is in backwardation today Feb 2, 2018 ($VIX futures contango is negative and settles at -4.16%) There is a tail wind for $VXX and $UVXY holders The long term $VIX futures are the best guess of the market at what average volatility will be like going forward. Market believes that going forward, $VIX will be lower than current spot $VIX of 17.31 |
| Mactheriverrat 3,172 posts msg #141801 - Ignore Mactheriverrat modified |
2/3/2018 10:41:59 AM Submit To me this code could be applied to any filter from 13th_floor's deadly combo to TRO's Run Forrest Run to just a filter of S&P 500 stocks as a trigger. Using cma(DMA(8,-5),1) above (+)/below(-) previous cma(DMA(8,-5),8) as the trigger. Just throwing this out there for people to study if they want. |
| davesaint86 726 posts msg #141806 - Ignore davesaint86 |
2/3/2018 12:07:20 PM Mac - do you think this downward move is about over? |
| Mactheriverrat 3,172 posts msg #141809 - Ignore Mactheriverrat |
2/3/2018 12:54:12 PM Well until cma(DMA(8,-5),1) cross above cma(DMA(8,-5),8) its still in a downward movement- Unless someone has a Holy Grail indicator IMHO! |
| davesaint86 726 posts msg #141810 - Ignore davesaint86 |
2/3/2018 1:03:58 PM Good answer! I should have asked based on analyzing previous down moves do you think we are close to a bottom in this downtrend? |
| pthomas215 1,251 posts msg #141811 - Ignore pthomas215 |
2/3/2018 1:08:58 PM and that cross could be the 97 support level. believe it or not. already lost 21% of it's value in a couple weeks. |
| Mactheriverrat 3,172 posts msg #141812 - Ignore Mactheriverrat |
2/3/2018 2:22:37 PM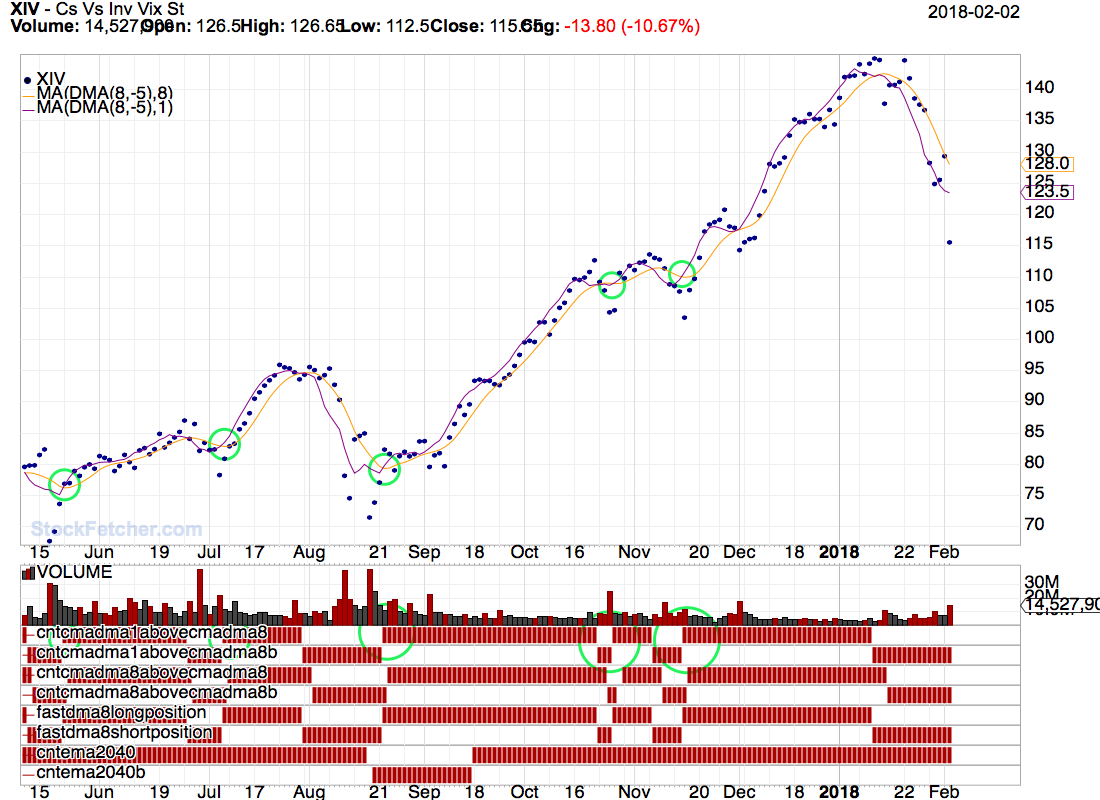 |
| davesaint86 726 posts msg #141814 - Ignore davesaint86 |
2/3/2018 7:16:01 PM I modified one of Kevin's Sharpe Allocation filters and embedded the code into my DMA8 filter. I do not know if it buys me anything. My goal is to find something that can get you in and out of a position faster when a trend changes abruptly. You can add whatever Bull/Inverse pair that you like to it (UGAZ/DGAZ, LABU/LABD, ZIV/VXZ, TMF/TMV, etc). I'm just playing around since I couldn't go skiing today. |
| davesaint86 726 posts msg #141815 - Ignore davesaint86 |
2/3/2018 7:20:02 PM Hedge 4-ETF Version |
| StockFetcher Forums · General Discussion · XIV | << 1 ... 13 14 15 16 17 ... 22 >>Post Follow-up |