| StockFetcher Forums · General Discussion · Stan Weinstein's Secrets For Profiting in Bull and Bear Markets | << 1 ... 6 7 8 9 10 ... 11 >>Post Follow-up |
| Mactheriverrat 3,178 posts msg #148798 - Ignore Mactheriverrat |
8/5/2019 8:07:02 PM Could be a very ugly August with this trade war thing. Basic Materials sector was pushed up by gold , mining stocks. 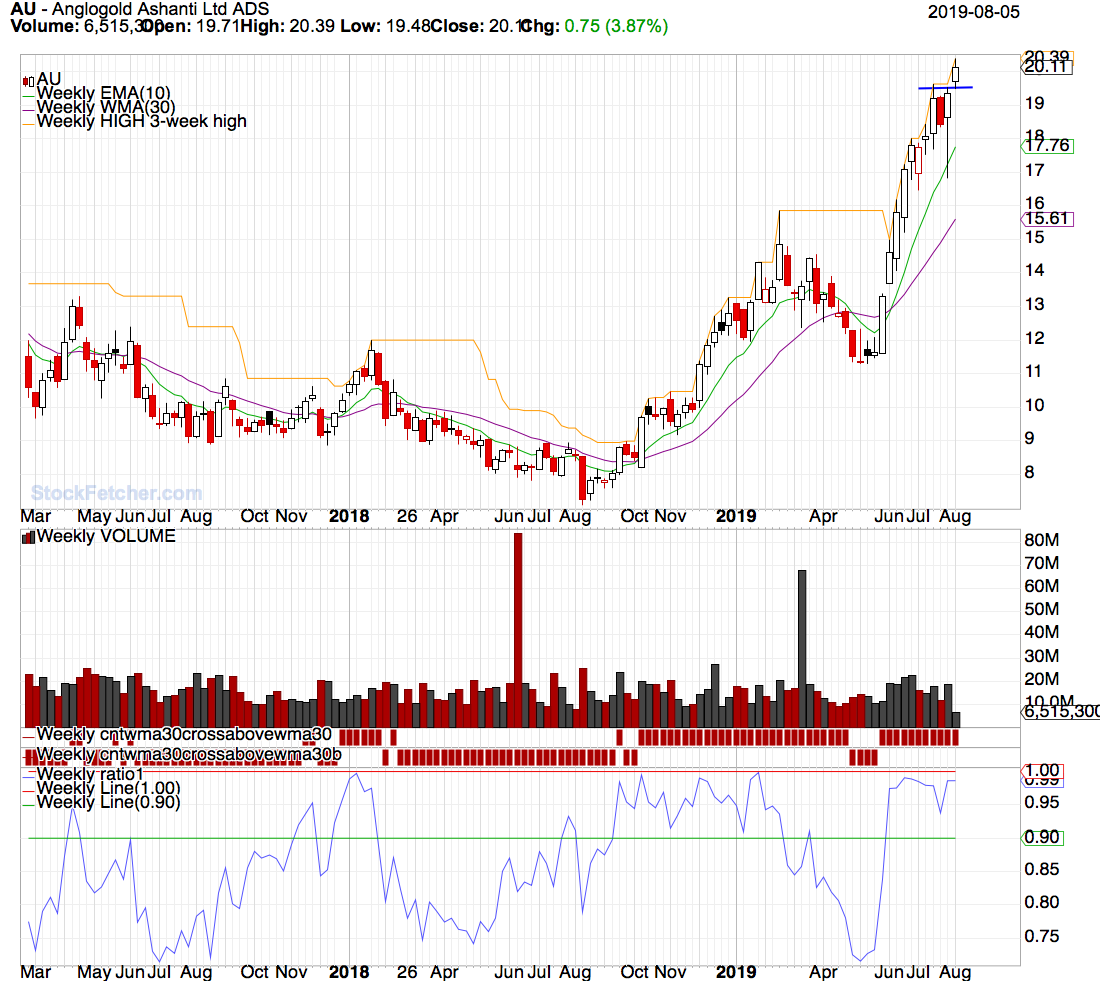 |
| Mactheriverrat 3,178 posts msg #148800 - Ignore Mactheriverrat modified |
8/5/2019 8:28:21 PM Submit Heck even KL got in on the flight to safety today. |
| SFMc01 358 posts msg #148812 - Ignore SFMc01 |
8/6/2019 6:51:54 PM graftonian: Your statement about SPY(8/3/2019 9:42:49 PM) made me curious and I ran a chart of SPY using WMA(30) and MA(150) ...because WMA(30) should equal 150 market days, I Thought...and MA(210)...in case WMA(30) equaled 210 calendar days .... and I got 3 different lines. Now I'm confused about which is correct and what was Stan Weinstein assuming. Or is Stockfetcher calculating WMA correctly. Or am I off base again? Steve |
| Mactheriverrat 3,178 posts msg #148813 - Ignore Mactheriverrat modified |
8/6/2019 9:01:17 PM I don't know where all this MA 150 , MA 210 stuff came from on daily chart came from. Weinstein's book NEVER talked about MA150 or MA 210 on daily charts. Weinstein's book was based on weekly chart's using the MA30 , EMA30 or from what the book says was Weighted Moving Average . I guess I need to post the page where Weinstein quotes - - PAGES 13 and 14 There is also another page that quotes Weinstein using 30 day Weighted Moving Average on Weekly charts. Sorry but its what the books says !!!!!!!!!!!!!!!!!!!!!!!!! Its less than a $14 dollar book. Its plain and simple. I read on another stock forum one time years ago that you can post a simple filter with a simple strategy . In given time that simple filter with a simple strategy will have turned into a very complexed filter and strategy that involves 27 indicators & 34 oscillators depending if the Sunrise is bright or if its cloudy when the Sunrise comes up in the morning. |
| graftonian 1,089 posts msg #148814 - Ignore graftonian |
8/6/2019 9:09:19 PM Steve, I get confused easily, and writing code in the weekly mode really f***s me up. I assumed MA(150) was the same as weekly MA(30). But what do I know? |
| Mactheriverrat 3,178 posts msg #148815 - Ignore Mactheriverrat |
8/6/2019 9:25:26 PM Stan Weinstein would be shaking his head right about now. |
| Mactheriverrat 3,178 posts msg #148817 - Ignore Mactheriverrat modified |
8/6/2019 11:20:08 PM I've been studying ETF 's using what SF has to offer that were around in the 6/2007 to 6/2010 great recession using Stan Weinstein's Secrets For Profiting in Bull and Bear Markets theory . SF has some so far and Ive been using Fedility's Mutal funds screeners to search for Bond funds that were around that did good during the great recession. CAGR = Compound Annual Growth Rate PTTAX = CAGR / 9.85% VBiiX = CAGR / 8.08% 7/2007 to 6/2010 |
| roca1018 163 posts msg #148820 - Ignore roca1018 |
8/7/2019 5:40:19 AM Thanks so much for the feedback on JBLU Rich |
| graftonian 1,089 posts msg #148827 - Ignore graftonian modified |
8/7/2019 10:27:19 AM deleted |
| Mactheriverrat 3,178 posts msg #148831 - Ignore Mactheriverrat |
8/7/2019 12:53:30 PM Sector(Basic Materials) doing good again today - GOLD and mining stock. |
| StockFetcher Forums · General Discussion · Stan Weinstein's Secrets For Profiting in Bull and Bear Markets | << 1 ... 6 7 8 9 10 ... 11 >>Post Follow-up |